I got acquainted with military topography in the second year of my institute. The conventional signs used there are slightly different from the general topographic ones due to the need to designate completely different objects. Moreover, there is a widely used color palette, which, in my opinion, makes these maps more readable.
Conditional tactical signs
Such signs on military maps indicate friendly and enemy troops, types of units (infantry, tanks) in the operational theater, the location of defensive structures, the direction of probable strikes, etc. The difference from ordinary maps lies in the need to depict special objects that are on civilian maps cannot be. For example, military helicopters alone can have several different image options, depending on their purpose: reconnaissance, combat, anti-submarine, etc. Colors play an important role for dynamic map information. In the Russian army, it is customary to use the following colors:
- Red - our troops. The same color is used to represent fires.
- Blue - enemy troops. It is also for flood zones.
- Black - position when moving our troops.
- Brown - roads and routes.
- Green - borders of radioactive contamination.

In the army of each military bloc, their colors and designations are adopted.
Symbols for divisions
As the teacher explained to me, a military map should be as difficult as possible for the enemy to read. Therefore, the images used on it should not be read intuitively. Roughly speaking, the tank should not be designated as a square with a line.

However, general requirements for their commanders must exist. At a time when plans were drawn by hand, an officer's line was suitable for this purpose. Yes, it is still used when creating large-scale plans, when it is necessary to accurately and quickly, in relatively calm conditions, outline a plan. But still, in all countries of the world, not even on purpose, but there are objects that are designated the same way. For example, a radio station in both the Russian Federation and NATO countries is symbolized by the lightning icon.
Any map has its own special language - special conventional signs. Geography studies all these designations, classifies them, and also develops new symbols to designate certain objects, phenomena and processes. It is useful for absolutely everyone to have a general idea of conventional cartographic signs. Such knowledge is not only interesting in itself, but will certainly be useful to you in real life.
This article is devoted to conventional signs in geography, which are used in the preparation of topographic, contour, thematic maps and large-scale terrain plans.
ABC cards
Just as our speech consists of letters, words and sentences, so any map includes a set of certain designations. With their help, topographers transfer this or that area onto paper. Conventional signs in geography are a system of special graphic symbols used to designate specific objects, their properties and characteristics. This is a kind of "language" of the map, created artificially.
It is rather difficult to say exactly when the very first geographical maps appeared. On all continents of the planet, archaeologists find ancient primitive drawings on stones, bones or wood, created by primitive people. So they depicted the area in which they had to live, hunt and defend themselves from enemies.
Modern conventional signs on geography maps display all the most important elements of the terrain: landforms, rivers and lakes, fields and forests, settlements, communication routes, country borders, etc. The larger the image scale, the more objects can be mapped . For example, on detailed plan areas, as a rule, all wells and sources of drinking water are marked. At the same time, marking such objects on a map of a region or country would be stupid and impractical.
A bit of history or how the symbols of geographical maps have changed
Geography is a science that is unusually closely related to history. Let's delve into it and we will find out how cartographic images looked many centuries ago.
Thus, the ancient medieval maps were characterized by the artistic rendering of the area with the widespread use of drawings as conventional signs. Geography at that time was just beginning to develop as a scientific discipline, therefore, when compiling cartographic images, the scale and outlines (boundaries) of areal objects were often distorted.

On the other hand, all the drawings on the old drawings and portolans were individual and completely understandable. But nowadays you have to connect your memory in order to learn what these or other conventional signs on maps in geography mean.
From about the second half of the 18th century, there was a tendency in European cartography to gradually move from individual perspective drawings to more specific plan symbols. In parallel with this, there was a need for a more accurate display of distances and areas on geographical maps.
Geography: and topographic maps
Topographic maps and terrain plans are distinguished by rather large scales (from 1:100,000 or more). They are most often used in industry, agriculture, exploration, urban planning and tourism. Accordingly, the terrain on such maps should be displayed as detailed and detailed as possible.
For this, a special system of graphic symbols was developed. In geography, it is also often called the "map legend". For ease of reading and ease of remembering, many of these characters resemble the real thing. appearance the objects of the terrain depicted by them (from above or from the side). This system of cartographic symbols is standardized and mandatory for all enterprises that are engaged in the production of large-scale topographic maps.
The topic "Conventional signs" is studied in the school geography course in the 6th grade. To test the level of mastery of a given topic, students are often asked to write a short topographical story. Each of you probably wrote a similar “essay” at school. Offers with conventional signs for geography look something like the photo below:

All symbols in cartography are usually divided into four groups:
- large-scale (areal or contour);
- off-scale;
- linear;
- explanatory.
Let us consider in more detail each of these groups of signs.
Scale signs and their examples
In cartography, scale signs are those that are used to fill in any areal objects. It can be a field, a forest or an orchard. With the help of these conventional signs on the map, you can determine not only the type and location of a particular object, but also its actual size.
The boundaries of areal objects on topographic maps and terrain plans can be depicted as solid lines (black, blue, brown or pink), dotted or simple dotted lines. Examples of scale cartographic signs are shown below in the figure:

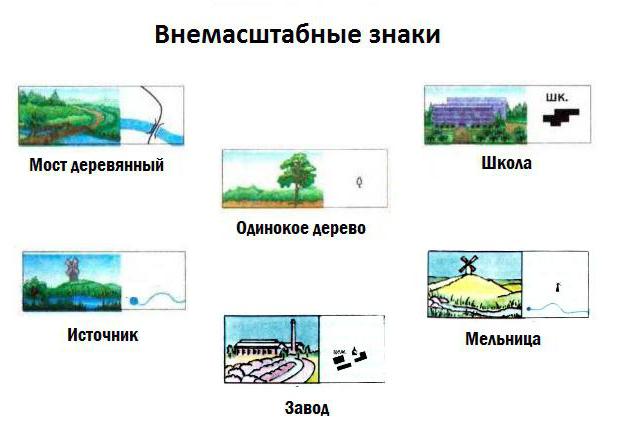
off-scale signs
If the object of the area cannot be depicted in the real scale of the plan or map, then in this case off-scale symbols are used. It's about about too small it can be, for example, a windmill, sculptural monument, rock-remnant, source or well.
The exact location of such an object on the ground is determined by the main point of the symbol. For symmetrical signs, this point is located in the center of the figure, for signs with a wide base - in the middle of the base, and for signs that are based on a right angle - at the top of such an angle.
It is worth noting that the objects expressed on the maps by non-scale conventional signs serve as excellent landmarks on the ground. Examples of off-scale cartographic signs are shown in the figure below:
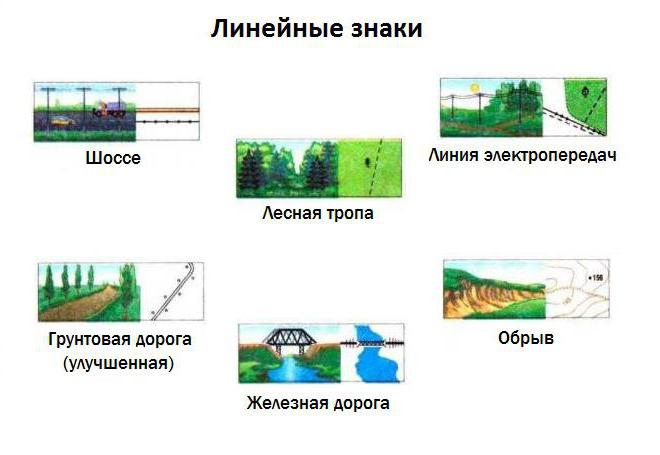
Linear signs
Sometimes the so-called linear cartographic signs are also distinguished into a separate group. It is easy to guess that with their help linearly extended objects are indicated on plans and maps - roads, boundaries of administrative units, railways, fords, etc. Interesting feature linear symbols: their length always corresponds to the scale of the map, but the width is significantly exaggerated.
Examples of linear cartographic symbols are shown in the figure below.
Explanatory signs
Perhaps the most informative is the group of explanatory conventional signs. With their help, additional characteristics of the depicted terrain objects are indicated. For example, a blue arrow in a riverbed indicates the direction of its flow, and the number of transverse strokes on the designation railway corresponds to the number of paths.
On maps and plans, as a rule, the names of cities, towns, villages, mountain peaks, rivers and other geographical objects are signed. Explanatory symbols can be numeric or alphabetic. Letter designations most often served in an abbreviated form (for example, a ferry crossing is indicated as an abbreviation "par.").
Symbols for contour and thematic maps
A contour map is a special kind of geographical maps intended for educational purposes. It contains only a coordinate grid and some elements of the geographical basis.
The set of conventional symbols for contour maps in geography is not very wide. The very name of these maps is quite eloquent: for their compilation, only contour designations of the boundaries of certain objects - countries, regions and regions - are used. Sometimes rivers and large cities are also plotted on them (in the form of dots). By and large, a contour map is a “silent” map, which is precisely designed to fill its surface with certain conventional signs.
Thematic maps are most often found in atlases of geography. The symbols of such cards are extremely diverse. They can be depicted as a color background, areas or so-called isolines. Diagrams and cartograms are often used. In general, each type of thematic map has its own set of specific symbols.
Comparison of the properties of a geographical map and a plan of the area.
Area plan. Geographic map
Map- a reduced generalized symbolic image of the surface of the Earth (its part), other planets or the celestial sphere, built on a scale and projection.
Terrain plan- a drawing of the area, made in conventional symbols and on a large scale (1: 5000 and larger).
When constructing plans, the curvature of the earth's surface is not taken into account, because small areas or areas of terrain are depicted.
The difference between the site plan and geographical map:
1) the plans depict small areas of the terrain, so they are built on a large scale (for example, 1 cm - 5 m). Geographic maps show much larger territories, their scale is smaller;
2) the plan depicts the area in detail, keeping the exact outlines of the depicted objects, but only in a reduced form. The large scale of the plan allows you to reflect on it almost all objects located on the ground. On a map that has a smaller scale, all objects cannot be plotted, therefore, when creating maps, objects are generalized. The exact outlines of all objects on the map also cannot be shown, so they are distorted to one degree or another. Many objects on the map, in contrast to the plan, are depicted with off-scale conventional signs;
3) when constructing a plan, the curvature of the earth's surface is not taken into account, since a small area of \u200b\u200bthe terrain is depicted. When building a map, it is always taken into account. Maps are built in certain cartographic projections;
4) there is no degree network on the plans. Parallels and meridians must be put on the map;
5) on the plan, the direction to the north is by default considered the direction up, the direction to the south - down, to the west - to the left, to the east - to the right (sometimes on the plan the direction north - south is shown by an arrow that does not coincide with the direction up - down). On the maps, the north-south direction is determined by the meridians, the west-east by the parallels.
Comparison of cartographic image methods. Ways of depicting objects and phenomena on geographical maps
Conventional signs- designations used on maps to depict various objects and their qualitative and quantitative characteristics. Symbolically denoted as real objects(for example, settlements) and abstract (for example, population density). Conventional signs are intended to indicate the type and some characteristics of the objects (phenomena) depicted on the map and determine their position in space.
Symbols are:
— off-scale(used to depict objects that cannot be expressed on a map scale). Are these drawings or geometric figures, the shape of which usually resembles the depicted object (Fig. 1). Alphabetic symbols also refer to off-scale conventions. The position of the object on the ground corresponds to the center of the sign of a symmetrical shape, the middle of the base of the sign with a wide base, the top of the corner of the sign with the base in the form of a right angle, the center of the bottom figure of the sign, which is a combination of several figures;
— linear(used to depict objects of a linear nature - rivers, roads, borders, pipelines, etc.). On a scale, they convey only the length and shape of the object, their width is exaggerated, so it cannot be measured (Fig. 2);
— areal, or contour(used to depict geographical objects that occupy a certain area - a lake, an array of forests, etc.). The actual value of the objects is transmitted (Fig. 3).
They consist of a contour (forest, swamp, etc.) and its filling (color, shading).
Explanatory conventional signs (for example, arrows showing the direction of the river flow, figures of deciduous and coniferous trees, etc.), signatures, alphabetic and numeric designations also carry certain information on the map.
Cartographic imaging methods
Quality background method. It is used to display on the map the qualitative features of certain objects or phenomena that have a continuous distribution on the earth's surface or occupy large areas. Its essence lies in the fact that on the map, areas that are homogeneous in terms of a certain feature (features) are distinguished (for example, natural areas) and painted over (or hatched) in the colors selected for them (hatching).
Area method. area- the area of \u200b\u200bdistribution on the earth's surface of a phenomenon (for example, the territory on which a certain animal lives, or the territory on which this or that agricultural crop is grown, etc.).
The isoline method. Contours(from the Greek isos - equal) - lines on maps passing through points with the same value of any quantitative indicator (temperature, precipitation, depth, height, etc.) characterizing the depicted phenomenon. For example, isotherms are lines connecting places with the same temperature; isobaths - lines connecting places with the same depth; Contours are lines connecting points on the earth's surface with the same absolute height. The essence of the isoline method is that on the map points with the same values of a certain indicator are connected by thin lines, i.e., contour lines are drawn.
Movement lines. Lines (arrows) show the direction of movement of any objects - air masses, winds, ocean currents, rivers, etc.
Determination of directions, measurement of distances on the plan and map
On the plan, north-south is indicated by an arrow. If there is no arrow on the plan, then it is considered that north is above, south is below.
On the map, directions are determined using a degree network. The north-south direction corresponds to the direction of the meridians, the west-east direction corresponds to the parallels.
Azimuth measurements according to the cards are produced using a protractor. Azimuth- the angle formed at a given point or on the map between the direction to the north and any object and counted clockwise.
So, if the object is strictly north of the point where the observer is located, then the azimuth to it will be 0 °, to the east - 90 °, to the south - 180 °, to the west - 270 °. Azimuths can have values from 0° to 360°. In order to measure the azimuth on the map, it is necessary to draw a line parallel to the north-south direction through the starting point of the direction being determined. Then, also through the point, draw a line connecting the point and the object to which you want to determine the azimuth. And then, using a protractor, measure the resulting angle (azimuth), given that the azimuth is always counted clockwise.
Determination of geographical coordinates
Gradient network and its elements. Degree network of the Earth- a system of meridians and parallels on geographical maps and globes, which serves to count the geographical coordinates of points on the earth's surface - longitudes and latitudes - or to plot objects on a map by their coordinates.
To create a degree network, certain reference points are needed. The spherical shape of the Earth determines the existence of two fixed points on the earth's surface - the poles. An imaginary axis passes through the poles, around which the Earth rotates.
Geographic poles- mathematically calculated points of intersection of the imaginary axis of rotation of the Earth with the earth's surface.
Equator- an imaginary line on the earth's surface, obtained by mentally dissecting the ellipsoid into two equal parts (Northern and Southern hemisphere). All points on the equator are equidistant from the poles. The plane of the equator is perpendicular to the Earth's axis of rotation and passes through its center. The hemispheres are mentally separated by many more planes parallel to the plane of the equator. The lines of their intersection with the surface of the ellipsoid are called parallels. All of them, like the plane of the equator, are perpendicular to the axis of rotation of the planet. Parallels on the map and the globe can be drawn as many as you like, but usually on training maps they are drawn at intervals of 10-20 °. Parallels are always oriented from west to east. The circumference of the parallels decreases from the equator to the poles. It is highest at the equator and zero at the poles.
When the globe is crossed by imaginary planes passing through the axis of the Earth perpendicular to the plane of the equator, large circles are formed - meridians. Meridians can also be drawn through any point of the ellipsoid. All of them intersect at the points of the poles (Fig. 4). The meridians are oriented from north to south. Average arc length of 1° meridian: 40,008.5 km: 360° = 111 km. All meridians are the same length. The direction of the local meridian at any point can be determined at noon by the shadow of any object. In the Northern Hemisphere, the end of the shadow always shows the direction to the north, in the Southern - to the south.
The degree network is necessary for counting the geographical coordinates of points on the earth's surface - latitude and longitude.
Geographic latitude- distance along the meridian in degrees from the equator to any point on the surface of the Earth. The equator is the starting point. The latitude of all points on it is 0. At the poles, the latitude is 90°. North latitude is measured north of the equator, south latitude is measured south.
Geographic longitude- distance along the parallel in degrees from the prime meridian to any point on the earth's surface. All meridians are equal in length, so for the reference it was necessary to choose one of them. They became the Greenwich meridian, passing near London (where the Greenwich Observatory is located). Longitude is measured from 0° to 180°. To the east of the zero meridian to 180 °, eastern longitude is counted, to the west - western.
Thus, using degree network, it is possible to accurately determine geographical coordinates - quantities that determine the position of a point on the earth's surface relative to the equator and the prime meridian. For example, the geographic coordinates of Cape Chelyuskin (the northernmost point of Eurasia) are 78° N. sh. and 104° E. d.
Determination of distances on the map
scale called the ratio of the length of the line in the drawing, plan or map to the length of the corresponding line in reality. The scale shows how many times the distance on the map is reduced relative to the actual distance on the ground. If, for example, the scale of a geographical map is 1:1,000,000, this means that 1 cm on the map corresponds to 1,000,000 cm on the ground, or 10 km.
There are numerical, linear and named scales.
Numerical scale is depicted as a fraction, in which the numerator is equal to one, and the denominator is a number showing how many times the lines on the map (plan) are reduced relative to the lines on the ground. For example, a scale of 1:100,000 shows that all linear dimensions on the map are reduced by 100,000 times. Obviously, the larger the scale denominator, the smaller the scale; with a smaller denominator, the scale is larger. The numerical scale is a fraction, so the numerator and denominator are given in the same measurements (centimeters).
Linear scale is a straight line divided into equal segments. These segments correspond to a certain distance on the depicted terrain; divisions are indicated by numbers. The measure of length along which the divisions on the scale bar are marked is called the base of the scale. In our country, the scale base is taken equal to 1 cm. The number of meters or kilometers corresponding to the scale base is called the scale value. When constructing a linear scale, the number 0, from which the counting of divisions begins, is usually placed not at the very end of the scale line, but retreating one division (base) to the right; on the first segment to the left of 0, the smallest divisions of the linear scale are applied - millimeters. The distance on the ground corresponding to one smallest division of the linear scale corresponds to the accuracy of the scale, and 0.1 mm corresponds to the maximum accuracy of the scale. The linear scale compared to the numerical one has the advantage that it makes it possible to determine the actual distance on the plan and map without additional calculations.
Named Scale- the scale expressed in words, for example, in 1 cm 250 km. (Fig. 5):
Measuring distances on the map and plan. Measuring distances with a scale. To measure the distance, you need to draw a straight line (if you need to know the distance in a straight line) between two points and use a ruler to measure this distance in centimeters, and then multiply the resulting number by the scale value. For example, on a map with a scale of 1: 100,000 (in 1 cm 1 km), the distance is 5 cm, i.e. on the ground, this distance is 1.5 = 5 (km). If you need to measure the distance between objects marked with off-scale conventional signs, then measure the distance between the centers of the conventional signs.
Measuring distances using a degree network. To calculate distances on a map or globe, the following quantities can be used: the length of an arc of 1° of the meridian and 1° of the equator is approximately 111 km. The total length of the earth's meridian is 40,009 km. Due to the fact that the Earth is flattened at the poles (polar compression), the length of an arc of 1 ° along the meridian at the equator (110.6 km) is less than at the poles (111.7 km). It is believed that the average length of 1 ° meridian is 111.1 km. The length of the arc 1° along the parallels decreases towards the poles. At the equator, it can also be taken equal to 111 km, and at the poles - 0 (because the pole is a point). To determine the distance in kilometers between two points lying on the same meridian, calculate the distance between them in degrees, and then multiply the number of degrees by 111.1 km. To determine the distance between two points on the equator, you also need to determine the distance between them in degrees, and then multiply by 111.1 km. To determine the distance between two points located on the same parallel, it is necessary to know the number of kilometers corresponding to the length of 1 ° arc of each particular parallel.
Definition of standard and zone time
Time Zones. Local and standard time. Solar time at points located on the same meridian is called local . Due to the fact that at each moment of the day it is different on all meridians, it is inconvenient to use it. Therefore, according to the international agreement, standard time was introduced. The entire surface of the Earth was divided along the meridians into 24 zones of 15 ° longitude. Belt (the same within each belt) time is the local time of the median meridian of this belt. Zero belt - this is a belt, the median meridian of which is the Greenwich (zero) meridian. From it, the belts are counted to the east.
Since 2014, 11 time zones have been established on the territory of Russia. The starting point for calculating the local time of time zones is Moscow time- time of the II time zone (see map). Thus, the difference in time between the first time zone and the eleventh is 10 hours.
It is conditionally believed that a new day begins in the 12th time zone (through which the 180 ° meridian passes - the date line). To the west of the international date line, a new day begins (according to the calendar). Therefore, in the logbook of a ship that sails from west to east, one day should be counted twice, and a ship moving from east to west, as it were, "skips" one day, after December 31 it immediately falls into January 2.
The use of statistical materials to determine trends in the development of geographical processes and phenomena
To reflect the trends in the development of processes, statistical tables are often used, where data are presented as a percentage of the previous year - the volume of last year's production is 100%. Therefore, if any number greater than 100 is indicated for the next year in the table, then the volume of production in this year was greater than in the previous one.
Building a relief profile on a map
The image of the relief on the maps. The relief on the maps is depicted by contour lines, special symbols and elevation marks.
Contours- lines on the map along which all points of the earth's surface have the same absolute height. The difference between two heights of adjacent horizontals is called the relief section. The smaller the cross section of the relief, the more detailed it is depicted. The size of the relief section depends on the scale of the map and on the nature of the relief itself. The most detailed relief is depicted on topographic maps. For example, on a map at a scale of 1:25,000 (at 1 cm 250 m), solid contour lines are drawn through 5 m, and on a map at a scale of 1: 100,000 (at 1 cm 1 km), a relief section of 20 m is used for flat areas and 40 m for mountain. On small-scale maps, an uneven section of the relief is usually used: more frequent in flat areas and enlarged in mountainous areas. So, on the physical map of Russia at a scale of 1:25,000,000, horizontal lines are drawn at a height of 0, 200, 500, 1000, 2000, 3000, 4000 m. Isobaths (depth contours) are also shown.
Horizontally, one can easily determine the absolute height of any point on the earth's surface and the relative height of two points (the excess of one over the other). Contours also help determine the steepness of slopes. The closer the horizontals are to each other, the steeper the slope. Additional information about the relief on topographic maps give berghashes- small strokes drawn perpendicular to the horizontals, indicating in which direction the relief is lowering.
For the depiction of relief forms that are not expressed by horizontal lines (for example, sharp ledges, cliffs, ravines, etc.), special conventional signs are used.
Absolute heights peaks or troughs on the maps are signed with numbers. Absolute heights are given in meters.
Understand general character relief changes are helped by elements of hydrography - for example, if a river is depicted on the map, then, as a rule, there is a general lowering of the relief of the right left bank to its channel. The direction of the river flow also indicates the direction in which the absolute height of the points decreases.
Definition 1
Cartographic symbols- symbolic graphic designations that are used to depict various objects and their characteristics on cartographic images (maps and topographical plans).
Sometimes symbols are called map legend.
Types of conventional signs by scale
Depending on the scale, $3$ groups of conventional signs are distinguished:
- scale (areal and linear);
- off-scale (point);
- explanatory.
With the help of areal scale signs, extended objects are displayed on a map scale. Scale signs on the map allow you to determine not only the location of the object, but also its size and shape.
Example 1
Scale marks are the territory of the state on a $1:10,000,000 scale map or a reservoir on a $1:10,000 scale map.
Linear conventional signs are used to display objects that are significantly extended in one dimension, for example, roads. Consistent with the scale on such signs, only one dimension (in which the object is the most extended), while the other is off-scale. The position of an object is determined by a conditional or explicit center line.
Out-of-scale point symbols are used on maps to represent objects whose dimensions are not expressed on the map. The largest cities on the world map are displayed as off-scale signs - dots. The actual placement of the object is determined by the main point of the point symbol.
The main point is placed at off-scale signs as follows:
- in the center of the figure near symmetrical signs;
- in the middle of the base for signs with a wide base;
- at the top of the right angle, which is the base, if the sign has such an angle;
- in the center of the lower figure, if the sign is a combination of several figures.
Explanatory signs are intended to characterize local objects and their varieties. Explanatory signs may indicate the number of railroad tracks, the direction of the river.
Remark 1
On large-scale maps, the signs of individual objects are indicated separately, on maps of a smaller scale, objects of the same type are grouped and applied with one sign.
Conventional signs by content
- signs and signatures of settlements;
- signs of individual local objects;
- signs of individual relief elements;
- transport infrastructure signs;
- signs of hydrographic network objects;
- signs of soil and vegetation cover;
Signs and signatures of settlements
On maps at a scale of $1:100,000 and larger, all settlements are indicated along with the signature of their names. Moreover, the names of cities are applied in direct capital letters, rural settlements - in lowercase letters, urban and suburban settlements - in lowercase oblique letters.
Large-scale maps display the exterior outline and layout, highlighting major highways, businesses, prominent knowledge and landmarks.
Example 2
On the $1:25 \ 000$ and $1:50 \ 000$ scale maps, the type (fireproof or non-fireproof) of the development is displayed in color.
The figure below shows signs of settlements used on maps of various eras.
Signs of individual local objects
Separate local objects, which are landmarks, are drawn on the map mainly with off-scale signs. It can be towers, mines, adits, churches, radio masts, remnant rocks.
Signs of individual relief elements
Relief elements are marked on the map with appropriate signs.
Remark 2
An object of natural origin is depicted by lines and signs Brown.
Transport infrastructure signs
The objects of transport infrastructure displayed on topographic maps include the road and railway network, structures and bridges.
When plotted on a map, paved roads (motorways, improved highways, improved dirt roads) and unpaved roads are distinguished. All paved roads are plotted on the map, indicating the width and material of the pavement.
The color of the road on the map indicates its type. Highways and highways are applied in orange, improved dirt roads in yellow (occasionally orange), unpaved country roads, field, forest and seasonal roads without color.
Signs of objects of the hydrographic network
The following elements of the hydrographic network are depicted on the map - the coastal part of the seas, rivers, lakes, canals, streams, wells, ponds and other bodies of water.
Reservoirs are plotted on the map if their area on the image is more than $1 mm^2$. In another case, a body of water is applied only because of high importance, for example in dry areas. Objects are labeled with their name.
The characteristics of the objects of the hydrographic network are indicated next to the signature of the name of the object. In particular, they indicate in the form of a fraction the width (numerator), depth and nature of the soil (denominator), as well as the speed (in m / s) and direction of the current. Also indicated along with the characteristics of hydraulic structures - ferries, dams, locks. Rivers and canals are mapped in full. In this case, the type of display is determined by the width of the object and the scale of the map.
Remark 4
In particular, at a map scale of more than $1:50,000$, objects less than $5$ m wide, at a map scale of less than $1:100,000$ - less than $10$ m, are depicted by a $1$ line, and wider objects by two lines. Also, $2$ lines designate channels and ditches with a width of $3$ m or more, and with a smaller width - one line.
On large-scale maps, blue circles indicate wells, the letter “k” or “art.k” is placed next to it in the case of an artesian well. In dry areas, wells and water supply facilities are shown with enlarged signs. Water pipelines on maps are shown by lines with dots of blue color: solid lines- ground, intermittent - underground.
Land cover signs
Often, when displaying land cover on a map, a combination of scale and off-scale symbols is used. Signs denoting forests, shrubs, gardens, swamps, meadows, nature are large-scale, and individual objects, for example, separately standing trees- off-scale.
Example 3
The swampy meadow is displayed on the map as a combination of conventional symbols of a meadow, bushes and a swamp in a closed contour.
The contours of areas of terrain occupied by a forest, shrub or swamp are applied with a dotted line, except when the boundary is a fence, roads or other linear local object.
Forested areas indicate in green with the application of a symbol indicating the type of forest (coniferous, deciduous or mixed). Areas with forest growth or nurseries are plotted in pale green on the map.
Example 4
The image below shows a coniferous pine forest on the left with an average tree height of $25$ meters and a width of $0.3$ m, and a typical distance between tree trunks of $6$ m. The image on the right shows a deciduous maple forest with a tree height of $12$ m and a trunk width of $0.2$ m, the distance between which is $3$ meters on average.
Swamps are shown on the map with blue horizontal shading. At the same time, the type of hatching shows the degree of passability: intermittent hatching - passable, solid - difficult and impassable.
Remark 5
Swamps with a depth of less than $0.6$ m are considered passable.
Vertical shading in blue on the map indicates salt marshes. As well as for swamps, solid shading indicates impenetrable solonchaks, broken shading indicates passable ones.
Colors of symbols on topographic maps
The colors that depict objects on maps are universal for all scales. Black dashed marks - buildings, structures, local objects, strong points and boundaries, brown dashed marks - relief elements, blue - hydrographic network. Areal signs of light blue color - a water mirror of hydrographic network objects, green color - areas of tree and shrub vegetation, orange color - quarters with fire-resistant buildings and highways, yellow - quarters with non-fire-resistant buildings and improved dirt roads.
Remark 6
Special symbols are applied on military and special maps.
Definition 1
Cartographic symbols- symbolic graphic designations that are used to depict various objects and their characteristics on cartographic images (maps and topographical plans).
Sometimes symbols are called map legend.
Types of conventional signs by scale
Depending on the scale, $3$ groups of conventional signs are distinguished:
- scale (areal and linear);
- off-scale (point);
- explanatory.
With the help of areal scale signs, extended objects are displayed on a map scale. Scale signs on the map allow you to determine not only the location of the object, but also its size and shape.
Example 1
Scale marks are the territory of the state on a $1:10,000,000 scale map or a reservoir on a $1:10,000 scale map.
Linear conventional signs are used to display objects that are significantly extended in one dimension, for example, roads. Consistent with the scale on such signs, only one dimension (in which the object is the most extended), while the other is off-scale. The position of an object is determined by a conditional or explicit center line.
Out-of-scale point symbols are used on maps to represent objects whose dimensions are not expressed on the map. The largest cities on the world map are displayed as off-scale signs - dots. The actual placement of the object is determined by the main point of the point symbol.
The main point is placed at off-scale signs as follows:
- in the center of the figure near symmetrical signs;
- in the middle of the base for signs with a wide base;
- at the top of the right angle, which is the base, if the sign has such an angle;
- in the center of the lower figure, if the sign is a combination of several figures.
Explanatory signs are intended to characterize local objects and their varieties. Explanatory signs may indicate the number of railroad tracks, the direction of the river.
Remark 1
On large-scale maps, the signs of individual objects are indicated separately, on maps of a smaller scale, objects of the same type are grouped and applied with one sign.
Conventional signs by content
- signs and signatures of settlements;
- signs of individual local objects;
- signs of individual relief elements;
- transport infrastructure signs;
- signs of hydrographic network objects;
- signs of soil and vegetation cover;
Signs and signatures of settlements
On maps at a scale of $1:100,000 and larger, all settlements are indicated along with the signature of their names. Moreover, the names of cities are applied in direct capital letters, rural settlements - in lowercase letters, urban and suburban settlements - in lowercase oblique letters.
Large-scale maps display the exterior outline and layout, highlighting major highways, businesses, prominent knowledge and landmarks.
Example 2
On the $1:25 \ 000$ and $1:50 \ 000$ scale maps, the type (fireproof or non-fireproof) of the development is displayed in color.
The figure below shows signs of settlements used on maps of various eras.
Signs of individual local objects
Separate local objects, which are landmarks, are drawn on the map mainly with off-scale signs. It can be towers, mines, adits, churches, radio masts, remnant rocks.
Signs of individual relief elements
Relief elements are marked on the map with appropriate signs.
Remark 2
An object of natural origin is represented by lines and signs in brown.
Transport infrastructure signs
The objects of transport infrastructure displayed on topographic maps include the road and railway network, structures and bridges.
When plotted on a map, paved roads (motorways, improved highways, improved dirt roads) and unpaved roads are distinguished. All paved roads are plotted on the map, indicating the width and material of the pavement.
The color of the road on the map indicates its type. Highways and highways are applied in orange, improved dirt roads in yellow (occasionally orange), unpaved country roads, field, forest and seasonal roads without color.
Signs of objects of the hydrographic network
The following elements of the hydrographic network are depicted on the map - the coastal part of the seas, rivers, lakes, canals, streams, wells, ponds and other bodies of water.
Reservoirs are plotted on the map if their area on the image is more than $1 mm^2$. In another case, a body of water is applied only because of high importance, for example in dry areas. Objects are labeled with their name.
The characteristics of the objects of the hydrographic network are indicated next to the signature of the name of the object. In particular, they indicate in the form of a fraction the width (numerator), depth and nature of the soil (denominator), as well as the speed (in m / s) and direction of the current. Also indicated along with the characteristics of hydraulic structures - ferries, dams, locks. Rivers and canals are mapped in full. In this case, the type of display is determined by the width of the object and the scale of the map.
Remark 4
In particular, at a map scale of more than $1:50,000$, objects less than $5$ m wide, at a map scale of less than $1:100,000$ - less than $10$ m, are depicted by a $1$ line, and wider objects by two lines. Also, $2$ lines designate channels and ditches with a width of $3$ m or more, and with a smaller width - one line.
On large-scale maps, blue circles indicate wells, the letter “k” or “art.k” is placed next to it in the case of an artesian well. In dry areas, wells and water supply facilities are shown with enlarged signs. Water pipelines on the maps are shown by lines with blue dots: solid lines - ground, broken lines - underground.
Land cover signs
Often, when displaying land cover on a map, a combination of scale and off-scale symbols is used. Signs denoting forests, shrubs, gardens, swamps, meadows, nature are large-scale, and individual objects, for example, free-standing trees, are off-scale.
Example 3
The swampy meadow is displayed on the map as a combination of conventional symbols of a meadow, bushes and a swamp in a closed contour.
The contours of areas of terrain occupied by a forest, shrub or swamp are applied with a dotted line, except when the boundary is a fence, roads or other linear local object.
Forested areas are indicated in green with a symbol indicating the type of forest (coniferous, deciduous or mixed). Areas with forest growth or nurseries are plotted in pale green on the map.
Example 4
The image below shows a coniferous pine forest on the left with an average tree height of $25$ meters and a width of $0.3$ m, and a typical distance between tree trunks of $6$ m. The image on the right shows a deciduous maple forest with a tree height of $12$ m and a trunk width of $0.2$ m, the distance between which is $3$ meters on average.
Swamps are shown on the map with blue horizontal shading. At the same time, the type of hatching shows the degree of passability: intermittent hatching - passable, solid - difficult and impassable.
Remark 5
Swamps with a depth of less than $0.6$ m are considered passable.
Vertical shading in blue on the map indicates salt marshes. As well as for swamps, solid shading indicates impenetrable solonchaks, broken shading indicates passable ones.
Colors of symbols on topographic maps
The colors that depict objects on maps are universal for all scales. Black dashed marks - buildings, structures, local objects, strong points and boundaries, brown dashed marks - relief elements, blue - hydrographic network. Areal signs of light blue color - a water mirror of hydrographic network objects, green color - areas of tree and shrub vegetation, orange color - quarters with fire-resistant buildings and highways, yellow - quarters with non-fire-resistant buildings and improved dirt roads.
Remark 6
Special symbols are applied on military and special maps.