Fisher's equation
Prices and the amount of money are directly related.
Depending on various conditions, prices may change due to changes in the money supply, but the money supply can also change depending on changes in prices.
The exchange equation looks like in the following way:
Fisher formula
Undoubtedly, this formula is purely theoretical and unsuitable for practical calculations. Fisher's equation does not contain any single solution; within the framework of this model, multivariance is possible. However, under certain tolerances, one thing is certain: The price level depends on the amount of money in circulation. Usually two assumptions are made:
the speed of money turnover is a constant value;
All production capacities on the farm are fully utilized.
The meaning of these assumptions is to eliminate the influence of these quantities on the equality of the right and left sides of the Fisher equation. But even if these two assumptions are met, it cannot be unconditionally asserted that the growth of the money supply is primary, and the rise in prices is secondary. The dependence here is mutual.
In the conditions of stable economic development the money supply acts as a regulator of the price level. But with structural disproportions in the economy, a primary change in prices is also possible, and only then a change in the money supply (Fig. 17).
Normal economic development:

Disproportion of economic development:

Rice. 17. Dependence of prices on the money supply in conditions of stability or economic growth
Fisher formula (exchange equation) determines the amount of money used only as a medium of exchange, and since money also performs other functions, the determination of the total need for money involves a significant improvement in the original equation.
The amount of money in circulation
The amount of money in circulation and the total amount of commodity prices are related as follows:
The above formula was proposed by representatives quantitative theory of money. The main conclusion of this theory is that in each country or group of countries (Europe, for example) there must be a certain amount of money corresponding to the volume of its production, trade and income. Only in this case will the price stability. In the case of an inequality in the quantity of money and the volume of prices, changes in the price level occur:
In this way, price stability- the main condition for determining the optimal amount of money in circulation.
QUANTITY THEORY OF MONEY
On the question of the value of money, bourgeois political economy has long been dominated by the quantity theory of money, which asserts that the value of money is inversely related to its quantity.
The founders of the quantitative theory of money were Charles Montesquieu (1689-1755) in France, D. Locke (1671-1729) and D. Hume (1711-1776) in England. Adhering to nominalistic views on the question of the essence of money, the founders of the quantitative theory also saw in metallic money only a sign that did not have intrinsic value; they determined the value of gold and silver money by their number and argued that the more money there is in the country, the higher the commodity prices.
Unlike Montesquieu, who defined the value of money as the quotient of dividing the total amount of money by the total amount of goods, Hume determined the value of money by the ratio between the amount of money in circulation and the mass of goods on the market, believing that goods and money that do not enter into circulation do not affect for prices. The main flaw in the quantity theory of money is the denial of the function of money as a measure of value, in recognizing money as a mere medium of circulation, in its fetishization of the latter. The quantifiers believe that all money acquires "purchasing power" as a result of its circulation, and that money allegedly has no value before the process of circulation. K. Marx, criticizing Hume's quantitative theory, wrote:
"In his opinion, commodities enter the circulation process without price, and gold and silver without value."
Representatives of the quantity theory of money mistakenly believe that commodity prices are established in the sphere of circulation as a result of the ratio between the amount of money and goods. In reality, however, commodities are first measured in terms of money as a measure of value and acquire prices, and this happens before they go on sale and come into contact with money as a medium of circulation. The second flaw in the quantity theory of money is the identification of gold and paper money and the extension of the laws of circulation of paper money to gold and silver money.
The third flaw in the quantity theory is the misunderstanding of the relation between the value of money, the prices of commodities, and the quantity of money in circulation. Proponents of this theory argue that the amount of valuable money in circulation does not depend on the conditions of production, prices and value of goods, that any amount of money, even gold, can be in circulation, and that the amount of money determines their value and the price level of goods. K. Marx, showing that the prices of goods do not depend on the amount of money in circulation, but, on the contrary, the amount of full-fledged money necessary for circulation is determined by the level of commodity prices, wrote:
“Thus, prices are not high or low because more or less money is in circulation, but on the contrary, more or less money is in circulation because prices are high or low.”
A special group of supporters of the quantity theory represented by prominent English economists D. Ricardo (1772-1823), James Mill (1773-1836), John Stuart Mill (1806-1873) can be called representatives of the classical quantitative theory of money. They treated money as a commodity without depriving it of intrinsic value.
"...that commodities rise or fall in the chain in proportion to the increase or decrease in the quantity of money, I consider a fact beyond dispute."
D. Ricardo made an attempt to combine the quantity theory of money with the theory of labor value, for which he created the doctrine of the automatic regulation of the amount of gold in circulation by importing and exporting it abroad. According to this theory, net imports of gold or an increase in domestic gold production increase the amount of money in circulation, resulting in an excess of money in circulation, leading to higher prices and a decrease in the relative value of money. This should lead to an outward flow of gold, causing the money supply to shrink, prices to fall to normal levels, and the relative value of gold to rise.
The failure of this theory lies in the erroneous assumption that all the gold in the country is a medium of exchange. In real life, even under conditions of gold circulation, a part of gold always serves as a treasure or world money and is not in the sphere of internal circulation. Ricardo did not understand the economic law governing the amount of money in circulation. According to this law, the amount of valuable money in circulation is always maintained at a level corresponding to the needs of circulation in money, and money that is not needed for circulation is hoarded and goes into treasures. During the period of the general crisis of capitalism, the quantity theory of money, combined with nominalism, is used to justify paper money circulation and the policy of inflation.
A prominent American representative of the so-called new quantitative theory of money I. Fisher (1867-1947) created a mathematical formula for the dependence of the price level on the money supply:
PQ=MV ,
where M is the money supply; V is the velocity of money circulation; Q - the number of circulating goods; P is the level of commodity prices.
Transforming this equation, we get that Fisher determines the level of commodity prices by the formula
P \u003d MV / Q,
those. the product of the mass of banknotes and the speed of their circulation, divided by the number of goods.
Based on this formula, Fisher concludes that the value of money is inversely proportional to its quantity:
“Thus,” writes the author, “from the simple fact that the money spent on goods must be equal to the quantity of these goods times their prices, it follows that the price level must rise or fall according to the change in the quantity of money, if in at the same time there will be no change in the speed of their circulation or in the amount of goods exchanged.
Fisher's "Equation of Exchange" PQ = MV expresses the quantitative relationships between the sum of commodity prices and the circulating money supply; but this equation does not give the right to conclude that the prices of commodities are determined by the amount of money in circulation. On the contrary, the quantity of money in circulation is determined by commodity prices, since commodities acquire prices before they enter circulation, and not by virtue of the functioning of money as a medium of circulation, but by virtue of the functioning of money as a measure of value.
The invisible hand of the market in balancing supply and demand
Each person, Adam Smith believed, regardless of the will and consciousness, is directed towards achieving economic benefits for the whole society. Thus, the invisible hand of the market is aimed at obtaining benefits for people. Each manufacturer, for example, strives for its own benefit, but the way to it lies through the satisfaction of the needs of a number of people. This is the whole essence of the principle of the invisible hand of the market: a set of different producers, as if driven by an invisible force, effectively, voluntarily, actively implements the interests of the whole society.
Profit performs a signal function in the mechanism of the invisible hand of the market and ensures the competent and harmonious distribution of all resources, that is, it balances supply and demand. So, if production is unprofitable, then the amount of resources involved will be reduced. Soon such production will disappear, because the environment of competitors will put pressure on it. The main principle of the invisible hand of the market is that resources are spent on profitable production.
Real Society and the Invisible Hand of the Market: The Problem of Embodiment
And although Adam Smith formulated the principle of the invisible hand of the market correctly, it is difficult to apply it to real economic life. Specific conditions must be taken into account. For example, in the second half of the nineteenth century, tremendous changes took place in the Western European economy. There were enterprises turning into monopolies. This is clearly not included in the model of the invisible hand of the market by all definitions. As a result of the development of technology, enterprises have become dependent on each other. Their ups and downs were simultaneous. Because of this, the market system collapsed, foreseen by Karl Marx. When the process of monopolization of Western markets began to gradually subside, in many industries, companies turned out to be uncompetitive. And today, monopolies in the economy do not interfere with the development of the economy at all, although such a model does not fit the description of the invisible hand mechanism at all.
How does the second hand work?
It turned out that the market also has a "second hand", and it exists much longer than even the "first". Economic relations can also be influenced by status differences between people. At the heart of this principle is the observation not of prices, but of what goods, services and with what effect are sold. Such a “hand” has ruled society since ancient times, it’s just that economists didn’t think about it. This is a new manifesto for the development of the market, which implies the provision of product diversity and a high rate of its renewal. By purchasing goods, people try to demonstrate their taste, position in society, that is, they mark their own status. Having understood such mechanisms, it is possible to create a completely new effective market management system in the future.
As Adam Smith pointed out, the amazing thing about an economy based on private property and free bargaining is that market prices subordinate the actions of self-interested people to the prosperity of society or the nation as a whole. The entrepreneur, “guided only by his own benefit,” is nonetheless guided by the “invisible hand” of market prices “towards a goal (namely, the economic prosperity of the country), which was not at all his intention.
Many people find it difficult to understand the law of the "invisible hand" because there is a natural tendency to associate order with central planning. If the task is a reasonable distribution of resources, it seems natural that some branch of the central government should be responsible for this. The law of the "invisible hand" states that this is not necessary at all. With private property and freedom of exchange, prices, forcing millions of consumers, producers and resource providers to make their personal choices, are also a means of harmonizing their interests. Prices contain information about consumer preferences, costs and factors related to time, location and other circumstances that neither an individual nor an entire planning body can take into account. Just one single summarizing figure - the market price - provides manufacturers with the full amount of information necessary to bring their personal actions into line with the actions and preferences of others. The market price guides and incentivizes both producers and resource providers to produce the things that are most valued relative to their cost of production.
Business decision makers don't need a central authority to tell them what to produce and how. This function is performed by prices. For example, no one has to force a farmer to grow wheat, to persuade a builder to build houses, or a furniture maker to make chairs. If the prices of these and other commodities indicate that consumers value their value at least at the same level as their cost of production, entrepreneurs, in pursuit of personal gain, will produce them.
There is also no need for a central authority to control the production methods of enterprises. Farmers, builders, furniture makers and many other manufacturers will seek the best combination of resources and the most efficient organization of production, since lower costs mean higher profits. It is in the interests of every manufacturer to reduce costs and improve quality. Competition practically forces them to do so. It will be difficult for producers with high costs to survive in the market. Consumers looking to make the most of their money will see to it.
The "invisible hand" of the market process works so automatically that most people don't even think about it. They simply take it for granted that goods are produced in roughly the quantities that consumers want to purchase them. The long queues that characterize centrally planned economies are virtually unfamiliar to people living in a market economy. The availability of a huge variety of products that strikes the imagination of even modern consumers is also largely taken for granted. The "invisible hand" creates order, harmony and variety. This process, however, goes so latently that few people understand its essence, and only a few do it justice. However, it is decisive for the economic well-being of society.
|
|||||||||
The theory of unemployment by the English economist J. M. Keynes, which can be called the theory of insufficient demand, has the greatest distribution in modern bourgeois political economy. According to Keynes, "the volume of employment is in a very definite way related to the volume of effective demand", and the presence of "underemployment", i.e. unemployment, is due to the limited demand for goods.
Keynes derives the insufficiency of consumer demand from the properties of human psychology, stating that the propensity to consume decreases with increasing income. According to him, as their income grows, people spend less and less of it on consumption and save more and more, and the decrease in the propensity to consume is supposedly an eternal psychological law.
“The psychology of society,” says Keynes, “is such that with the growth of total real income, aggregate consumption also increases, but not to the extent that income grows.”
Keynes explains the lack of demand for the means of production by the weakness of the "stimulus to investment." This "incentive to invest" depends, in his opinion, on many factors: on what income the capitalist expects to receive as a result of investments, on whether he believes in the reliability of investments or considers them risky, whether he evaluates economic, optimistic or pessimistic, social and political perspectives, etc. Here Keynes also assigns the main role to psychological aspects.
Keynes attaches particular importance to the level of lending interest. He argues that the level of interest is the regulator of the amount of investment and that the higher the rate of interest, the less incentive for entrepreneurs to invest. The rate of interest, according to Keynes, under modern capitalism is too high, which slows down investment and thus leads to high unemployment.
Acting, in the witty expression of William Foster, as an emergency doctor in a sick capitalism, Keynes argues that unemployment is such a disease of modern capitalism that it is completely curable if only the right medicines are applied.
“It is clear,” wrote Keynes, “that the world will no longer tolerate the unemployment which, except for short periods of excitement, accompanies and, in my opinion, inevitably accompanies modern capitalist individualism. However, with the help of a correct analysis of the problem, it is possible to cure the disease and at the same time preserve efficiency and freedom, that is, to destroy unemployment while maintaining capitalism, which Keynes considers synonymous with "efficiency and freedom."
To eliminate unemployment under capitalism, according to Keynes, it is necessary to increase government spending, which supposedly can compensate for the insufficient propensity to consume individuals and bring the total amount of effective demand to a level that ensures "full employment". He further considers it necessary to stimulate investment by lowering the rate of interest, for which the state and central banks should increase the issuance of paper money or fiat banknotes. Keynes's doctrine found numerous followers: in England - V. Beveridge, J. Robinson and others, in the USA - E. Hansen,
S. Harris and others, as well as in other capitalist countries. Keynesians also proceed from the position of the determining role of market demand. For example, according to E. Hansen, "the only thing missing before the war, the only thing the American economy needs, is sufficient aggregate demand"
Calling the problem of supplying such demand "the most important problem," Hansen writes:
"You cannot rely on the private economy to generate sufficient energy on its own to provide full employment."
Therefore, he advocates an increase in government spending as a way to ensure full employment. Noting the "tremendous increase in the government's financial operations," Hansen states that "this is the Xinxian cure for stagnation," a means of securing sufficient aggregate demand and full employment.
“Inflation is when with your money you can no longer buy as much as in those days when you had no money,” ironically American writer Leonard Louis Levinson.
Admit that no matter how sad, but it's true. Constant inflation eats away at our income.
We make investments, counting on certain percentages, but what do we have in reality?
To answer these and similar questions, the Fisher formula has been developed. Inflation, money supply, price level, interest rates and real profitability - we read about this in the article.
Relationship between money supply and prices - Fisher's equation
Regulation of the amount of money in circulation and the price level is one of the main methods of influencing the market-type economy. The relationship between the quantity of money and the price level was formulated by representatives of the quantity theory of money. In a free market (market economy) it is necessary to regulate economic processes to a certain extent (Keynesian model).


Fisher formula: inflation
The regulation of economic processes is carried out, as a rule, either by the state or by specialized bodies. As the practice of the 20th century showed, many other important economic parameters depend on the amount of money used in the economy, primarily the level of prices and the interest rate (the price of a loan). The relationship between the price level and the amount of money in circulation was clearly formulated within the framework of the quantity theory of money.
Prices and the amount of money are directly related. Depending on various conditions, prices may change due to changes in the money supply, but the money supply can also change depending on changes in prices.


Undoubtedly, this formula is purely theoretical and unsuitable for practical calculations. Fisher's equation does not contain any single solution; within the framework of this model, multivariance is possible. At the same time, under certain tolerances, one thing is certain: the price level depends on the amount of money in circulation. Usually two assumptions are made:
- the speed of money turnover is a constant value;
- All production capacities on the farm are fully utilized.
The meaning of these assumptions is to eliminate the influence of these quantities on the equality of the right and left sides of the Fisher equation. But even if these two assumptions are met, it cannot be unconditionally asserted that the growth of the money supply is primary, and the rise in prices is secondary. The dependence here is mutual.
Under conditions of stable economic development, the money supply acts as a regulator of the price level. But with structural imbalances in the economy, a primary change in prices is also possible, and only then a change in the money supply.
Fisher's formula (the equation of exchange) determines the amount of money used only as a medium of circulation, and since money performs other functions, the determination of the total need for money implies a significant improvement in the original equation.
The amount of money in circulation
The amount of money in circulation and the total amount of commodity prices are related as follows:


The above formula was proposed by representatives of the quantity theory of money. The main conclusion of this theory is that in each country or group of countries (Europe, for example) there must be a certain amount of money corresponding to the volume of its production, trade and income. Only in this case price stability will be ensured. In the case of an inequality in the quantity of money and the volume of prices, changes in the price level occur:
- MV = PT - prices are stable;
- MV > PT - prices are rising (inflationary situation).
Thus, price stability is the main condition for determining the optimal amount of money in circulation.
Source: "grandars.ru"
Fisher Formula: Inflation and Interest Rates
Economists call bank interest the nominal rate of interest, and the increase in your purchasing power at the real rate of interest. If a nominal rate denote i as a percentage, and real rate percent - r, inflation - π, then the relationship between these three variables can be written as follows: r \u003d i - π, i.e. The real interest rate is the difference between the nominal interest rate and the inflation rate.
Regrouping the terms of this equation, we see that the nominal interest rate is the sum of the real interest rate and the inflation rate: i = r + π. An equation written in this form is called the Fisher equation. It shows that the nominal interest rate can change for two reasons: due to changes in the real interest rate or due to changes in the inflation rate.
The quantity theory of money and Fisher's equation show how an increase in the money supply affects the nominal rate of interest. According to the quantity theory of money, a 1% increase in the money supply causes an increase in the inflation rate by 1%.
According to the Fisher equation, a 1% increase in the inflation rate, in turn, causes a 1% increase in the nominal interest rate. This relationship between the rate of inflation and the nominal rate of interest is called the Fisher effect.
It is necessary to distinguish between two different concepts of the real interest rate:
- the real interest rate expected by the borrower and lender when issuing a loan (exante real interest rate) – i.e. expected, supposed;
- the actual real interest rate is expost.
Lenders and borrowers are not in a position to predict the future rate of inflation with complete certainty, but they have certain expectations about this. Denote by π the actual rate of inflation in the future, and by e the expected future rate of inflation. Then the real interest rate exante will be equal to i - πе, and the real interest rate expost will be equal to i - π x v.
How is the Fisher effect modified to account for the difference between expected and actual future inflation rates? The Fisher effect can be more accurately represented as follows: i = r + πе.The demand for money in real terms depends on both the level of income and the nominal interest rate. The higher the level of income Y, the greater the demand for cash reserves in real terms. The higher the nominal interest rate i, the lower the demand for them.
Source: "infomanagement.ru"
Nominal and real interest rate - Fisher effect
The nominal interest rate is the market interest rate without inflation, reflecting the current valuation of monetary assets.
The real interest rate is the nominal interest rate minus the expected rate of inflation.
For example, the nominal interest rate is 10% per annum and the projected inflation rate is 8% per annum. Then the real interest rate will be: 10 - 8 = 2%.
The difference between the nominal rate and the real one makes sense only in conditions of inflation or deflation.
The American economist Irving Fisher put forward an assumption about the relationship between the nominal, real interest rate and inflation, called the Fisher effect, which states that the nominal interest rate changes by the amount at which the real interest rate remains unchanged.
In formula form, the Fisher effect looks like this:

For example, if the expected inflation rate is 1% per year, then the nominal rate will increase by 1% in the same year, therefore, the real interest rate will remain unchanged. Therefore, it is impossible to understand the process of making investment decisions by economic agents without taking into account the difference between the nominal and real interest rates.
Consider a simple example: let's say you intend to give someone a loan for one year in an inflationary environment, what is the exact interest rate you set? If the growth rate of the general price level is 10% per year, then setting the nominal rate at 10% per annum with a loan of CU1000, you will receive CU1100 in a year.
But their real purchasing power will no longer be the same as a year ago. Nominal income increment of CU100 will be "eaten" by 10% inflation. Thus, the distinction between nominal and real interest rates is important for understanding exactly how contracts are made in an economy with an unstable general price level (inflation and deflation).
Source: "economicportal.ru"
Fisher effect
The effect, as a phenomenon, as a pattern, was described by the great American economist Irving Fisher in 1896. The general idea is that there is a long-term relationship between expected inflation and the interest rate (yield on long-term bonds). Content - an increase in expected inflation causes approximately the same increase in the interest rate and vice versa.
The Fisher Equation is a formula for quantifying the relationship between expected inflation and the interest rate.Simplified equation: if the nominal interest rate N is 10, the expected inflation I is 6, R is the real interest rate, then the real interest rate is 4 because R = N – I or N = R + I.
The exact equation. The real interest rate will differ from the nominal one as many times as the prices change. 1 + R = (1 + N)/(1 + I). If we open the brackets, then in the resulting equation, the value of NI for N and I less than 10% can be considered tending to zero. As a result, we get a simplified formula.
Calculation according to the exact equation with N equal to 10 and I equal to 6 will give next value R.
1 + R = (1 + N)/(1 + I), 1 + R = (1 + 0.1)/(1 + 0.06), R = 3.77%.
In the simplified equation, we got 4 percent. It is obvious that the boundary of the application of the simplified equation is the value of inflation and the nominal rate of less than 10%.
Source: "dictionary-economics.ru"
Essence of inflation
Imagine that in a secluded northern village, all workers had their wages doubled. What will change in a local store with the same offer, for example, chocolate? How would its equilibrium price change? Why does the same chocolate become more expensive? The money supply available to the population of this village increased, and demand increased accordingly, while the amount of chocolate did not increase.
As a result, the price of chocolate has risen. But the rise in the price of chocolate is not yet inflation. Even if all foodstuffs in the village rise in price, this will still not be inflation. And even if all goods and all services in this village rise in price, this will not be inflation either.
Inflation is a long-term sustained increase in the general price level. Inflation is the process of depreciation of money, which occurs as a result of the overflow of circulation channels with the money supply. How much money must circulate in the country in order for the price level to be stable?
The equation of exchange - Fisher's formula - allows you to calculate the money supply needed for circulation:
where M is the amount of money in circulation;
V is the velocity of money, which shows how many times 1 ruble changes hands in a certain period of time;
P is the average price per unit of output;
Y - real gross domestic product;
RU - nominal GDP.
The equation of exchange shows that every year the economy needs the amount of money that is required to pay for the value of the GDP produced. If more money is put into circulation or the velocity of circulation is increased, then the price level rises.
When the growth rate of the money supply exceeds the growth rate of the mass of commodities: MU > RU,
equilibrium is restored as a result of rising prices: MU = R|U.
An overflow of money circulation channels can occur if the velocity of money circulation increases. The same consequences can be caused by a reduction in the supply of goods on the market (a drop in production).
The degree of depreciation of money is determined in practice by measuring the rate of price growth.
In order for the price level in the economy to be stable, the government must maintain the growth rate of the money supply at the level of the average growth rate of real GDP. The amount of money supply is regulated by the Central Bank. Emission is the issuance of an additional amount of money into circulation.
Depending on the rate of inflation, inflation is conditionally distinguished:
- moderate
- galloping
- high
- hyperinflation.
If prices rise slowly, up to about 10% per year, then one usually speaks of moderate, “creeping” inflation.
If there is a rapid and abrupt increase in prices, measured in double digits, then inflation becomes galloping. With such inflation, prices rise no more than twice.
Inflation is considered high when prices rise by more than 100%, that is, prices rise several times.
Hyperinflation occurs when the depreciation of money becomes self-sustaining and uncontrollable, and the growth rates of prices and the money supply become exceptionally high. Hyperinflation is usually associated with war, economic disruption, political instability, and erroneous government policies. The rate of price growth during hyperinflation exceeds 1000%, i.e., during the year, prices rise by more than 10 times.
The intensive development of inflation causes distrust of money, and therefore there is a massive desire to turn it into real values, the "flight from money" begins. There is an increase in the velocity of circulation of money, which leads to an acceleration of their depreciation.Money ceases to fulfill its functions, and the monetary system comes into complete disorder and decline. This is manifested, in particular, in the introduction into circulation of various monetary surrogates (coupons, cards, other local monetary units), as well as hard foreign currency.
The collapse of the monetary system as a result of hyperinflation, in turn, causes the degradation of the entire national economy. Production is falling, normal economic ties are being disrupted, and the share of barter transactions is growing. There is a desire for economic isolation of various regions of the country. Growing social tension. Political instability is manifested in the lack of trust in the government.
This also reinforces distrust of money and its depreciation.
A classic example of hyperinflation is the state of German money circulation after the First World War in 1922-1923, when the rate of price growth reached 30,000% per month, or 20% per day.
Inflation manifests itself differently in different economic systems. In a market system, prices are formed under the influence of supply and demand; depreciation of money is open. In a centralized system, prices are formed by directives, inflation is suppressed, hidden. Its manifestations are the shortage of goods and services, the growth of monetary savings, the development of the shadow economy.
Factors causing inflation can be both monetary and non-monetary. Let's consider the main ones. Demand-pull inflation is the result of excessive growth in government spending, consumers and private investment. Another cause of inflation in demand may be the issue of money to finance government spending.In cost inflation, prices rise as firms increase their costs of production. For example, growth wages if it outpaces the growth of labor productivity, it can cause cost inflation.
- Inflation is a general rise in prices. It is caused by the excess of the growth rate of the money supply over the mass of commodities.
- According to the rate of price growth, four types of inflation are distinguished, of which the strongest is hyperinflation, which destroys the economy.
- Inflation is unpredictable. People with fixed incomes suffer the most from its consequences.
Source: "knigi.news"
How to correctly calculate the real yield adjusted for inflation
Probably everyone knows that the real yield is the yield minus inflation. Everything rises in price - products, goods, services. According to Rosstat, over the past 15 years, prices have increased 5 times. This means that the purchasing power of money that has just been lying in the nightstand all this time has decreased by 5 times, before they could buy 5 apples, now 1.
In order to somehow preserve the purchasing power of their money, people invest it in various financial instruments: most often these are deposits, currency, real estate. More advanced ones use stocks, mutual funds, bonds, precious metals. On the one hand, the amount of investments is growing, on the other hand, they are depreciating due to inflation.
If you subtract the inflation rate from the nominal rate of return, you get the real rate of return. It can be positive or negative. If the return is positive, your investment has multiplied in real terms, that is, you can buy more apples, if it is negative, it has depreciated.
Most investors calculate real returns using a simple formula:
Real Return = Nominal Return - Inflation
But this method is inaccurate. Let me give you an example: let's take 200 rubles and put them on a deposit for 15 years at a rate of 12% per annum. Inflation over this period is 7% per year. If we consider the real yield using a simple formula, we get 12-7=5%. Let's check this result by counting on the fingers.
For 15 years, at a rate of 12% per annum, 200 rubles will turn into 200 * (1 + 0.12) ^ 15 = 1094.71. Prices during this time will increase by (1+0.07)^15=2.76 times. To calculate the real profitability in rubles, we divide the amount on the deposit by the inflation coefficient 1094.71/2.76=396.63. Now, to translate the real yield into percentages, we consider (396.63/200)^1/15 -1 * 100% = 4.67%. This is different from 5%, that is, the test shows that the calculation of real yield in the "simple" way is not accurate.
where Real Rate of Return - real yield;
nominal rate - nominal rate of return;
inflation rate - inflation.
We check:
(1 + 0.12) / (1 + 0.07) -1 * 100% \u003d 4.67% - Converges, so the formula is correct.
Another formula that gives the same result looks like this:
RR=(nominal rate-inflation)/(1+inflation)
The greater the difference between nominal yield and inflation, the greater the difference between the results calculated by the "simple" and "correct" formula. This happens a lot in the stock market. Sometimes the error reaches several percent.
Source: "activeinvestor.pro"
Calculation of inflation. Inflation indices
The inflation index is an economic indicator that reflects the dynamics of prices for services and goods that the population of the country pays for, that is, for those products that are purchased for further use, and not for overproduction.
The inflation index is also called the consumer price index, which is an indicator of measuring the average level of prices for consumer goods over a certain period of time. Different methods and formulas are used to calculate the inflation index.
Calculation of the inflation index using the Laspeyres formula
The Laspeyres index is calculated by weighing the prices of 2 time periods according to the same consumption volumes of the base period. Thus, the Laspeyres index reflects the change in the cost of services and goods of the base period that has occurred over the current period.
The index is defined as the ratio of consumer spending on the purchase of the same set of consumer goods, but at current prices (∑Qo×Pt), to spending on the purchase of goods and services in the base period (∑Qo×Po):


where Pt - prices in the current period, Qo - prices for services and goods in the base period, Po - the number of services and goods produced in the base period (as a rule, 1 year is taken for the base period).
It should be noted that the Laspeyres method has significant drawbacks due to the fact that it does not take into account changes in the structure of consumption.
The index only reflects changes in income levels, not taking into account the substitution effect, when the prices of some goods fall and this leads to an increase in demand. Consequently, the method of calculating the inflation index according to the Laspeyres method in some cases gives a slightly overestimated value.
Calculation of the inflation index using the Paasche formula
Another way to calculate the inflation index is based on the Paasche formula, which also compares the prices of two periods, but in terms of consumption volumes of the current period:


where Qt are prices for services and goods in the current period.
However, the Paasche method also has its own significant drawback: it does not take into account price changes and does not reflect the level of profitability. Therefore, when prices for some services or products decrease, the index overestimates, and when prices increase, it underestimates.
Calculation of the inflation index using the Fisher formula
In order to eliminate the shortcomings that are inherent in the Laspeyres and Paasche indices, the Fisher formula is used to calculate the inflation index, the essence of which is to calculate the geometric mean of the 2 above indices:
![]()
![]()
Many economists consider this formula to be ideal, as it compensates for the shortcomings of the Laspeyres and Paasche formulas. But, despite this, experts in many countries prefer the choice of one of the first two methods.
For example, for international reporting, the Laspeyres formula is used, since it takes into account that some goods and services may, in principle, fall out of consumption in the current period for one reason or another, in particular during the economic crisis in the country.
Gross domestic product deflator
An important place among inflation indices is occupied by the GDP deflator - a price index that includes all services and goods in the consumer basket. The GDP deflator allows you to compare the growth in the general level of prices for services and goods over a certain economic period.
This indicator is calculated in the same way as the Paasche index, but measured as a percentage, that is, the resulting number is multiplied by 100%. As a rule, the GDP deflator is used by the state statistical offices for reporting.
Big Mac Index
In addition to the above official methods for calculating the inflation index, there are also such non-traditional methods for determining it, such as, for example, the Big Mac or hamburger index. This method of calculation makes it possible to study how today in different countries ah evaluated the same products.
The well-known hamburger is taken as the basis, and all because it is sold in many countries of the world, it has a similar composition almost everywhere (meat, cheese, bread and vegetables), and the products for its manufacture, as a rule, are of domestic origin.
Thus, the most expensive hamburgers today are sold in Switzerland ($6.81), Norway ($6.79), Sweden ($5.91), the cheapest ones are in India ($1.62), Ukraine ($2.11), Hong Kong ($2.12). As for Russia, the cost of a hamburger here is $2.55, while in the US a hamburger costs $4.2.
What does the hamburger index say? The fact that if the cost of a Russian Big Mac in terms of dollars is lower than the cost of a hamburger from the United States, then the official exchange rate of the Russian ruble is underestimated against the dollar.
Thus, it is possible to compare currencies of different countries, which is very simple and the easy way recalculation national currencies.Moreover, the cost of a hamburger in each country directly depends on the volume of production, prices for raw materials, rent, labor and other factors, so the Big Mac index is one of best ways see the discrepancy between the value of currencies, which is especially important in a crisis, when a "weak" currency provides some advantages in terms of prices and costs for products, and an expensive currency becomes simply unprofitable.
Borscht index
In Ukraine, after carrying out, to put it mildly, unpopular reforms, an analogue of the Western Big Mag index was created, which has the patriotic name "borscht index". AT this case The study of price dynamics is carried out exclusively on the cost of the ingredients that make up the national Ukrainian dish - borscht.
However, if in 2010-2011 the borscht index could “save the situation” by showing the people that a plate of borscht now costs a little less, then in 2012 the situation changed dramatically. So, the borscht index showed that in September 2012 the average borscht set, consisting of vegetables, costs as much as 92% more than in the same period last year.
This rise in prices has led to the fact that the volume of purchases of vegetables by the population in Ukraine has decreased by an average of 10-20%.
As for meat, on average it has risen in price by 15-20%, but by this winter a rapid rise in price up to 30-40% is expected due to the increase in prices for fodder grain. On average, borscht made from potatoes, meat, beets, carrots, onions, cabbage, tomatoes and a bunch of greens is taken as the basis for assessing changes in the price level according to the borscht index.
Source: "provincialynews.ru"
Exchange rate and inflation
Inflation is the most important indicator of the development of economic processes, and for the currency markets - one of the most significant benchmarks. Currency dealers are watching inflation data very carefully. From the perspective of the foreign exchange market, the impact of inflation is naturally perceived through its relationship with interest rates.
Since inflation changes the ratio of prices, it also changes the benefits actually received from the income generated by financial assets. This impact is usually measured using real interest rates (Real Interest Rates), which, in contrast to conventional (nominal, Nominal Interest Rates) take into account the depreciation of money that occurs due to the general rise in prices.
An increase in inflation reduces the real interest rate, since some part must be deducted from the income received, which will simply go to cover the price increase and does not give any real increase in the benefits (goods or services) received.The simplest way formal inflation accounting and consists in the fact that the nominal rate i is considered as the real interest rate minus the inflation coefficient p (also given as a percentage),
A more accurate relationship between interest rates and inflation is provided by Fisher's formula. For obvious reasons, government securities markets (interest rates on such securities are fixed at the time of their issue) are very sensitive to inflation, which can simply destroy the benefits of investing in such instruments.
The effect of inflation on government securities markets is easily transferred to closely related foreign exchange markets: the dumping of bonds denominated in a certain currency crs, which occurred due to rising inflation, will lead to an excess in the cash market in this currency crs, and consequently, to a fall in it. exchange rate.
In addition, the inflation rate is the most important indicator"health" of the economy, and therefore it is carefully monitored by central banks.
The means of combating inflation is to raise interest rates. Rising rates divert part of the cash from business turnover, as financial assets become more attractive (their profitability grows along with interest rates), loans become more expensive; as a result, the amount of money that can be paid for goods and services produced falls, and consequently the rate of price growth also decreases.
Because of this close relationship with central bank rate decisions, foreign exchange markets closely monitor inflation indicators. Of course, individual deviations in inflation levels (for a month, a quarter) do not cause the reaction of central banks in the form of changes in rates; central banks follow trends, not individual values.
For example, low inflation in the early 1990s allowed the FED to keep the discount rate at 3%, which was good for economic recovery. But in the end, inflation indicators ceased to be essential benchmarks for the currency markets.Since the nominal discount rate was small, and its real version generally reached 0.6%, this meant for the markets that only upward movement of inflation indices made sense. The downtrend in the US discount rate was broken only in May 1994 when the FED raised it, along with the federal funds rate, as part of a pre-emptive inflation control measure. True, raising rates then could not support the dollar.
The main published indicators of inflation are the consumer price index (consumer price index), the producer price index (producer price index), and the GDP deflator (GDP implicit deflator). Each of them reveals its own part of the overall picture of price growth in the economy. Figure 1 illustrates the growth of consumer prices in the UK over the past 12 years.

Figure 1 UK consumer prices
This figure directly represents the cost of some consumer basket; the growth rate of this basket value is the commonly published consumer price index. On the chart, the growth rate is depicted by the slope of the trend line, along which the main upward trend in prices goes.
It is clearly seen that after overcoming the problems of 1992, which led to the exit of England from the European monetary union, the reforms carried out brought the economy to a different growth line, along which the price increase (the slope of the right trend line) is much less than it was at the end of the previous decade and in features - in 91-92 years.
An example of the actions of the central bank, based on its position on inflationary processes, and the reaction of the foreign exchange market caused by them, is shown in Figure 2, which shows a graph of the British pound against the dollar.


Figure 2. Chart of the British pound; Bank of England rate hike on September 8, 1999 and reaction to rumors of another hike
On September 8, 1999, a meeting of the Bank of England Monetary Policy Committee was held. None of the experts predicted then an increase in interest rates, since economic indicators did not show obvious signs of inflation, and the pound was already estimated too high. True, on the eve of the meeting there were many comments that the increase in rates of the Bank of England in 1999 or early 2000 is inevitable.
But no one predicted it for this meeting. Therefore, the decision of the Bank to raise its main interest rate by a quarter of a percent came as a surprise to everyone, which shows the first sharp rise in the pound.
The Bank explained its decision by the desire to prevent further price increases, signs of which he saw in the overheated housing market, strong consumer demand and the possibility of inflationary pressure from wages, since unemployment in England was at a fairly low level. Although it is possible that the Bank's decision was influenced by the recently implemented FED rate hike.
The second rise in the chart the next day was caused by active discussion in the market about the inevitability of a new rate hike soon (rate hike is a common term for raising central bank rates in market slang); there were, apparently, many willing not to be late to buy a pound before it rose even more. The fall of the pound at the end of the week was due to the reaction to the US inflation data, which will be discussed later.
Inflation and interest rates
The connection between inflation and the conditions of money circulation can be demonstrated on the basis of the basic equation of the theory of money, if we write it for the relative changes in its constituent values, which shows that under these conditions, price growth (inflation) is completely determined by the regulatory actions of the central bank through a change in the money supply.
In reality, of course, the causes of inflation are quite complex and numerous, the growth of the money supply is only one of them.
Suppose some amount S for the same period was invested at an interest rate i (which is called the nominal interest rate, nominal interest rate), that is, the amount S will turn over the same period into S -> S (l + i). At the beginning of the period under review (at the old prices), it was possible to purchase the amount of goods Q=S/P for the amount S.
The real interest rate is called the interest rate in real terms, that is, determined through the increase in the volume of goods and services. In accordance with this definition, the real interest rate r will give for the same period under consideration the change in the volume Q,
Collecting all the above relations, we get,
Q(l + r) = S(l + i)/ P(l + p) = Q * (1 + i)/ (1 + p),
whence we obtain the expression for the real interest rate in terms of the nominal interest rate and the inflation rate,
r=(l+i)/(l+p)-l.
The same equation, written in a slightly different form,
characterizes the well-known Fisher effect in macroeconomics.
Fisher formula and monopoly price increase
Apparently, there are two types of prices: competitive and monopoly. The mechanism of competitive pricing is well researched. With a stable money supply, it never leads to an irrevocable rise in prices. When there is a market shortage of a commodity, the enterprises that produce it may temporarily raise prices.
However, after a certain period of time, capital will flow into this sector of the economy, that is, where a high rate of profit has temporarily formed. The influx of capital will make it possible to create new capacities for the production of scarce goods, and after a certain time an excess of this goods will form on the market. In this case, prices may even fall below the general level, as well as below the cost level.
Ideally, with the complete absence of monopolies in the market and with some constant technological progress, in the absence of an excess money supply in circulation, the market economy does not produce inflation. On the contrary, such an economy is characterized by deflation.Monopoly is another matter. They discourage competition and can inflate prices at will. The growth of monopolies is often a natural consequence of competition. When weak competitors die and only one winner remains in the market, it becomes a monopolist. Monopolies are general and local. Some of them are natural (unremovable).
Other monopolies are established temporarily, but this does not make it easier for consumers and the entire economy of the country. They fight monopolies. All countries with developed market economies have antitrust laws. However, this is a recognition of the fact that monopolies cannot be dealt with by market methods alone. The state forcibly divides large monopolies. But in their place, oligopolies can form.
Price collusion is also pursued by the state, but it is not easy to prove. Sometimes certain monopolies, especially those engaged in energy, transport and military production, are placed under strict state control, just as was done in the socialist countries.
Arbitrary price increases by monopolies are important point in cost inflation theory.
So, suppose there is a certain monopoly that intends to use its position in the market to raise prices, that is, in order to increase its share of income in the country's total NI. It could be an energy, transport or information monopoly.8 It could be a trade union, which can be considered a de facto monopoly in the sale of labor. (John Keynes himself considered trade unions to be the most aggressive monopolies in this respect).
Monopolies can also include the state, which collects taxes as a payment for the services it provides to maintain security, order, social security, and so on. Let's start with one of the possible cases. Let's say a private monopoly raised its tariffs (either the government increased taxes, or the unions won higher wages). In this case, we accept the condition that the money supply M remains constant.
Then, for one turnover of the money supply, the following condition is satisfied:
Thus, all changes in the equation, if they occur at all, will have to occur on the right side of the equation (p * q). There is a change - it is an increase in the weighted average price p. Therefore, an increase in price will necessarily lead to a decrease in the volume of q sold.
- Under conditions of invariance of the money supply for one period of circulation, a monopoly increase in prices leads to a reduction in the sale (and production) of goods.
- However, one more, more optimistic conclusion can be drawn: Inflation caused by monopolies, given a constant money supply, cannot last as long as inflation caused by the printing of money. A complete halt in production cannot be beneficial to the monopolies. There is a limit to which it is advantageous for a private monopoly to raise tariffs.
In support of the conclusions of the Fisher formula, we can find any number of examples in the history of economics. Strong inflation is usually accompanied by a reduction in production. However, in this case, almost always, money emission was also added to the monopoly increase in prices. At the same time, with strong inflation, there is often a relative contraction in the money supply.
Fisher formula
This formula allows you to express risk-free rate from the ruble of investments through the real rate without risk income r (it is also sometimes called the real interest rate without risk) and inflation expectations s:
R = r + s + rchs(7)
Rate s of expected inflation(averaged over the period n remaining until the end of the useful life of the business) can be determined by:
1) from the forecasts of research centers;
2) based on the official forecast of expected inflation;
3) by own forces of specialists in the development of a feasibility study.
The real risk-free lending rate can be evaluated:
1) taking for it the market rate of return on the shortest-term government bonds (in terms of the required longer period of the "step" t) - keeping in mind that for enough short term circulation of such bonds, inflation simply does not have time to have any significant effect;
2) equating it with the profitability of operations in the markets of those relatively risk-free (based on high demand) goods and services where the domestic economy has already managed to integrate into the world markets for these goods and services (i.e. where a competitive domestic market open for them for imports combined with active export of the same goods and services abroad); the actual yield in these markets will then reflect how the real interest rate (at the level of 3-4%) has long stabilized in the industrialized countries of the world.
Determining the discount rate for discounting without debt cash flows
For discounting without debt cash flow, a discount rate calculated using the weighted average cost of capital (WACC) method is used.
Non-debt cash flow does not take into account the size and movement of the enterprise's future debt. And therefore, in order to reflect the share and cost of borrowed funds in such a future cash flow, discounting this non-debt cash flow is carried out at an income rate equal to the weighted average cost of borrowed and equity capital of the enterprise being valued, i.e. the interests of the creditor are taken into account in the process of forming not the cash flow, but the discount rate.
The current value of the discounted cash flow determined in this way (ie the value of the enterprise being valued at the date of valuation) characterizes the current value of all invested capital - both equity and debt.
The calculation without debt cash flow is similar to determining the cash flow for equity, except for the following:
· the decrease in debt is not taken into account;
· the increase in debt is not taken into account;
· cash payments on interest for debt servicing are not taken into account (not deducted from profit).
Calculation scheme without debt cash flow.
Without debt, the cash flow is equal to = Net profit (the cost of paying interest on loans in excess of the discount rate of the Central Bank is not deducted from profit, but only income tax is deducted) + Depreciation (full) + Decrease in own working capital - Increase in own working capital - Capital investments.
When implementing this algorithm for assessing an enterprise, in order to determine the value of the enterprise's own funds, it is necessary to subtract the cost of borrowed capital from the cost of all invested capital, i.e. amount of debt. If the profit is formed to a large extent by attracting borrowed funds for production, then it is more expedient to evaluate the enterprise based on a non-debt cash flow (i.e., excluding interest payments and changes in liabilities).
The main arguments for using one or another type of cash flow are the following judgments. If the profit (or cash flow) of an enterprise is formed mainly from its own funds without significant borrowing, then the cash flow to equity is used to value the enterprise.
In accordance with this formula, the price level is determined by the formula: P=MV/Q
The amount of money in circulation (money supply) M = PQ / V
Based on this formula, Fisher concludes that the value of money is inversely proportional to its quantity. Fisher's formula MV = PQ makes it possible to explain the phenomenon of inflation in terms of violations in the sphere of paper money circulation. Economic interpretation of the formula M = PQ/V: the more national product created in the country, the more money should be in circulation. With an increase in the physical quantity of goods and the prices of these goods, the money supply must be increased, and, conversely, as the quantity of goods and prices for them decrease, the money supply must be narrowed. Under conditions of inflation, the amount of money in circulation is sensitive to the price level. For the normal functioning of commodity circulation and money circulation, it is necessary to increase the money supply in accordance with the rise in prices. Failure to comply with this principle leads to failures in the functioning of the commodity-money system, a shortage of money in circulation. State control over the money supply is necessary in order to influence prices, production, and the economy as a whole.
Wikimedia Foundation. 2010 .
See what the "Fischer formula" is in other dictionaries:
A stable distribution in probability theory is a distribution that can be obtained as a limit on the distribution of sums of independent random variables. Contents 1 Definition 2 Remarks 3 Properties of stable distributions ... Wikipedia
Fisher's exact test is a statistical significance test used in the analysis of contingency tables for small sample sizes. Named after its inventor R. Fisher. Refers to accurate tests significance, because not ... ... Wikipedia
A formula that sets the ratio between the change in bank interest rates and the change in spot exchange rates. According to the international Fisher effect, the difference in interest rates between two countries should be an unbiased predictor of the future... ... Financial vocabulary
FISHER DISTRIBUTION- is an analogue of the normal distribution on the sphere. R. Fisher's statistics is widely used in the processing of paleomagnetic data. Checking the compliance of the real distributions of the vectors Jn and its components with the Fisher distribution helps to evaluate ... ... Paleomagnetology, petromagnetology and geology. Dictionary reference.
Asymptotic expansion of the difference between the corresponding quantiles of the normal distribution and any distribution close to it in powers of a small parameter; studied by E. Cornish and R. Fisher. If F(x, t) is a distribution function,… … Mathematical Encyclopedia
Economics of a country- (National economy) The country's economy is public relations to ensure the country's wealth and the well-being of its citizens The role of the national economy in the life of the state, the essence, functions, sectors and indicators of the country's economy, the structure of countries ... ... Encyclopedia of the investor
The purchasing power of money: its definition and relation to credit, interest and crises (eng. The Purchasing Power of Money: Its determination and relation to credit, interest and crises, 1911) is a work of the American economist I. Fisher. ... ... Wikipedia
Interest rate- (Interest rate) The interest rate is the percentage of monetary profit that the borrower pays to the lender for the money capital taken on a loan Determination of the interest rate, types of interest rates on loans, real and nominal interest ... ... Encyclopedia of the investor
Z-transform- Formula for transforming a sample of r values (correlation coefficient) in order to approximate them to a normal distribution. Also called the Z Fisher transform... Dictionary in psychology
Correlation coefficient- (Correlation coefficient) The correlation coefficient is a statistical indicator of the dependence of two random variables Definition of the correlation coefficient, types of correlation coefficients, properties of the correlation coefficient, calculation and application ... ... Encyclopedia of the investor
Let's touch upon such a complex economic term as the discount rate, consider the existing modern methods of its calculation and directions of use.
The discount rate and its economic meaning
Discount rate (analogue: comparison rate, rate of return) is the interest rate that is used to revalue future capital at the current moment. This is done because one of the fundamental laws of economics is the constant depreciation of the value (purchasing power, value) of money. The discount rate is used in investment analysis when an investor decides on the prospect of investing in a particular object. To do this, he leads the future value of the investment object to the present (current). By conducting a comparative analysis, he can decide on the attractiveness of the object. Any value of an object is always relative, so the discount rate is the very basic criterion with which the investment efficiency is compared. Depending on various economic tasks, the discount rate is calculated in different ways. Consider the existing methods for estimating the discount rate.
Methods for estimating the discount rate
Let's consider 10 methods for estimating the discount rate for evaluating investments and investment projects of an enterprise/company.
- CAPM Capital Asset Valuation Models;
- Modified CAPM Capital Asset Valuation Model;
- Model by E. Fama and K. French;
- Model M. Carhart;
- Constant Growth Dividend Model (Gordon);
- Calculation of the discount rate based on the weighted average cost of capital (WACC);
- Calculation of the discount rate based on return on equity;
- Market multiplier method
- Calculation of the discount rate based on risk premiums;
- Calculation of the discount rate based on expert assessment;
Calculation of the discount rate based on the CAPM model
Capital asset valuation model - CAPM ( CapitalassetPricingModel) was proposed in the 1970s by W. Sharp (1964) to estimate the future return on shares/capital of companies. The CAPM reflects future returns as a risk-free return and a risk premium. As a result, if the expected return on a stock is lower than the required return, investors will refuse to invest in this asset. The factor that determines the future rate in the model was taken as market risk. The formula for calculating the discount rate for the CAPM model is as follows:
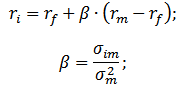 where: r i – expected return on shares (discount rate);
r f is the yield on a risk-free asset (for example: government bonds);
r m - market return, which can be taken as the average return on the index (MICEX, RTS - for Russia, S & P500 - for the USA);
β is the beta coefficient. It reflects the riskiness of an investment in relation to the market, and shows the sensitivity of changes in stock returns to changes in market returns;
σ im is the standard deviation of the change in stock return depending on the change in market return;
σ 2 m is the dispersion of the market return.
Advantages and Disadvantages of the CAPM Capital Asset Pricing Model
- The model is based on the fundamental principle of linking stock return to market risk, which is its advantage;
- The model includes only one factor (market risk) to estimate the future performance of a stock. Researchers such as Y. Fama, K. French and others introduced additional parameters into the CAPM model to increase its forecasting accuracy.
- The model does not take into account taxes, transaction costs, stock market opacity, etc.
Calculation of the discount rate according to the modified CAPM model
The main disadvantage of the CAPM model is its single-factor approach. Therefore, adjustments for unsystematic risk are also included in the modified capital asset pricing model. Unsystematic risk is also called specific risk, which occurs only under certain conditions. Formula for calculating the modified CAPM model (modifiedCapitalassetPricingModel ,MCAPM) is as follows:
![]() where: r i – expected return on shares (discount rate); r f is the yield on a risk-free asset (for example, government bonds); r m – market profitability; β is the beta coefficient; σ im is the standard deviation of the change in stock return from the change in market return; σ 2 m is the dispersion of market returns;
where: r i – expected return on shares (discount rate); r f is the yield on a risk-free asset (for example, government bonds); r m – market profitability; β is the beta coefficient; σ im is the standard deviation of the change in stock return from the change in market return; σ 2 m is the dispersion of market returns;
r u is the risk premium, which includes the non-systematic risk of the company.
As a rule, experts are used to assess specific risks, because they are difficult to formalize by means of statistics. The table below shows the various risk adjustments ⇓.
| Specific risks | Risk adjustment, % |
| State influence on tariffs | 0,4% |
| Changes in prices for raw materials, materials, energy, components, rent | 0,2% |
| Management risk of the owner/shareholders | 0,2% |
| Influence of key suppliers | 0,3% |
| Influence of seasonality of demand for products | 0,4% |
| Conditions for raising capital | 0,3% |
| In total, the adjustment for specific risk is: | 1,8% |
For example, let's calculate the adjusted discount rate, so if the CAPM model returns 10%, then the risk-adjusted discount rate will be 11.8%. Using the modified model allows you to more accurately determine the future rate of return.
Calculation of the discount rate according to the model of E. Fama and K. French
One of the modifications of the CAPM model was the three-factor model of E. Fama and K. French (1992), which began to take into account two more parameters that affect the future rate of return: company size and industry specifics. Below is the formula for the three-factor model by E. Fama and K. French:
where: r – discount rate; r f is the risk-free rate; r m – profitability of the market portfolio;
SMB t is the difference between the returns of the weighted average portfolios of shares of small and large capitalization;
HML t is the difference between the returns of weighted average stock portfolios with large and small ratios of book value to market value;
β, si, h i - coefficients that indicate the influence of parameters r i , r m , r f on the profitability of the i-th asset;
γ is the expected profitability of the asset in the absence of the influence of 3 risk factors on it.
Calculation of the discount rate based on the model of M. Karhat
The three-factor model of E. Fama and K. French was modified by M. Carhart (1997) by introducing the fourth parameter to assess the possible future profitability of a stock - the moment. The moment reflects the rate of price change for a certain historical period of time, when the fourth parameter is used in the model for assessing the profitability of a stock in the future, it is taken into account that the rate of price change also affects the future rate of return. Below is the formula for calculating the discount rate according to the M. Carhart model:
where: r – discount rate; WMLt - the moment, the rate of change in the value of the stock for the previous period.
Calculation of the discount rate based on the Gordon model
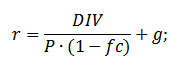
Another method for calculating the discount rate is to use the Gordon model (Constant Growth Dividend Model). This method has some restrictions on its use, because in order to estimate the discount rate, it is necessary that the company issues ordinary shares with dividend payments. Below is the formula for calculating the cost of equity of an enterprise (discount rate):
 where:
DIV is the amount of expected dividend payments per share per year;
P is the placement price of shares;
fc is the cost of issuing shares;
g is the growth rate of dividends.
Calculation of the discount rate based on the weighted average cost of capital WACC
Method for estimating the discount rate based on the weighted average cost of capital (eng. WACC, Weighted Average Cost of Capital) one of the most popular and shows the rate of return that should be paid for the use of investment capital. Investment capital can consist of two sources of financing: equity and debt. Often, WACC is used both in financial and investment analysis to assess the future return on investment, taking into account the initial conditions for the return (profitability) of investment capital. The economic meaning of calculating the weighted average cost of capital is to calculate the minimum allowable level of profitability (profitability, profitability) of the project. This indicator is used to evaluate the investment in an existing project. The formula for calculating the weighted average cost of capital is as follows:
![]()
where: r e ,r d is the expected (required) return on equity and borrowed capital, respectively;
E/V, D/V - share of own and borrowed capital. The sum of own and borrowed capital forms the capital of the company (V=E+D);
t is the income tax rate.
Calculation of discount rate based on return on equity
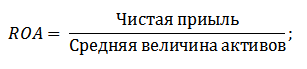
The advantages of this method lie in the possibility of calculating the discount rate for enterprises that are not listed on the stock market. Therefore, to assess the discount, indicators of return on equity and borrowed capital are used. These indicators are easily calculated by balance sheet items. If the company has both own and borrowed capital, then the indicator is used - return on assets (Return On Assets, ROA). The formula for calculating the return on assets is presented below:
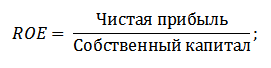
The next of the methods for estimating the discount rate through the return on equity (Return On Equity, ROE), which shows the efficiency/profitability of enterprise (company) capital management. The profitability ratio shows what rate of return the company creates at the expense of its capital. The formula for calculating the coefficient is as follows:
Developing this approach in assessing the discount rate through assessing the return on capital of an enterprise, a more accurate indicator can be used as a criterion for evaluating the rate - the return on capital employed (ROCE,returnOnCapitalEmployed). This indicator, unlike ROE, uses long term duties(through shares). This indicator can be used for companies that have preferred shares in the stock market. If the company does not have them, then the ROE equals ROCE. The indicator is calculated by the formula:
Another variation of the return on equity ratio is the return on average capital employed ROACE (Return on Average Capital Employed).
In fact, this indicator corresponds to ROCE, its main difference is the averaging of the cost of capital employed (Equity + long-term liabilities) at the beginning and end of the estimated period. The formula for calculating this indicator:
ROACE can often replace ROCE, for example in the EVA formula. Let us analyze the feasibility of using profitability ratios to assess the discount rate ⇓.
Calculation of the discount rate based on expert judgment
If you want to estimate the discount rate for a venture project, then using the CAPM, Gordon model and WACC methods is impossible, so experts are used to calculate the rate. The essence of expert analysis lies in the subjective assessment of various macro, meso and micro factors that affect the future rate of return. Factors that have a strong influence on the discount rate: country risk, industry risk, production risk, seasonal risk, managerial risk, etc. For each individual project, experts identify their most significant risks and evaluate them using scores. The advantage of this method is the ability to take into account all the possible requirements of the investor.
Discount rate calculation based on market multiples
This method is widely used to calculate the discount rate for enterprises that have issues of ordinary shares in the stock market. As a result, the market multiple E/P is calculated, which translates as EBIDA/Price. The advantage of this approach lies in the fact that the formula reflects industry risks when evaluating a company.
Calculation of the discount rate based on risk premiums
The discount rate is calculated as the sum of the risk-free interest rate, inflation and risk premium. As a rule, this method of estimating the discount rate is carried out for various investment projects, where it is difficult to statistically assess the amount of possible risk / return. The formula for calculating the discount rate, taking into account the risk premium:
![]() where:
where:
r is the discount rate;
r f is the risk-free interest rate;
r p is the risk premium;
I is the percentage of inflation.
The discount rate formula consists of the sum of the risk-free interest rate, inflation, and risk premium. Inflation was singled out as a separate parameter, because the depreciation of money goes on constantly, this is one of the most important laws of the functioning of the economy. Let's consider separately how each of these components can be evaluated.
Methods for estimating the risk-free interest rate
To assess the risk-free one, such financial instruments are used that give profitability at zero risk, that is, absolutely reliable. In reality, no instrument can be considered absolutely reliable, just the probability of losing money when investing in it is extremely small. Consider two methods for estimating the risk-free rate:
- Yield on risk-free government bonds (GKO - government short-term zero-coupon bonds, OFZ - federal loan bonds) issued by the Ministry of Finance of the Russian Federation. Government bonds have the highest reliability rating, so they can be used to calculate the risk-free interest rate. The yield on these types of bonds can be viewed on the website of the Central Bank of the Russian Federation (cbr.ru) and on average it can be taken as 6% per annum.
- Yield on 30-year US bonds. The average yield on these financial instruments is 5%.
Methods for estimating the risk premium
The next component of the formula is the risk premium. Since risks always exist, their impact on the discount rate should be assessed. There are many methods for assessing the additional risks of an investment, let's consider some of them.
Methodology for assessing risk adjustments from Alt-Invest
Alt-Invest's methodology includes in the risk adjustment the following types of risks, presented in the table ⇓.
Methodology of the Government of the Russian Federation No. 1470 (dated 11/22/97) for estimating the discount rate for investment projects
The purpose of this methodology is to evaluate investment projects for public investment. Specific risk and adjustment for them will be calculated through expert assessment To calculate the basic (risk-free) discount rate, the refinancing rate of the Central Bank of the Russian Federation was used, this rate can be viewed on the official website of the Central Bank of the Russian Federation (cbr.ru). The specific risks of the project are assessed by experts in the presented ranges. The maximum discount rate for this method will be 61%.
| Risk free interest rate | |
| FROM refinancing rate of the Central Bank of the Russian Federation | 11% |
| risk premium | |
| Specific risks | Risk adjustment, % |
| Investments for the intensification of production | 3-5% |
| Increasing product sales | 8-10% |
| The risk of introducing a new type of product to the market | 13-15% |
| R&D costs | 18-20% |
Methodology for calculating the discount rate Vilensky P.L., Livshits V.N., Smolyaka S.A.
| Specific risks | Risk adjustment, % |
| 1. The need to conduct R&D (with previously unknown results) by specialized research and (or) design organizations: | |
| duration of R&D less than 1 year | 3-6% |
| duration of R&D over 1 year: | |
| a) R&D is carried out by one specialized organization | 7-15% |
| b) R&D is complex and is carried out by several specialized organizations | 11-20% |
| 2. Characteristics of the applied technology: | |
| Traditional | 0% |
| New | 2-5% |
| 3. Uncertainty in the volume of demand and prices for manufactured products: | |
| existing | 0-5% |
| New | 5-10% |
| 4. Instability (cyclicality, seasonality) of production and demand | 0-3% |
| 5. Uncertainty of the external environment during the implementation of the project (mining and geological, climatic and other natural conditions, aggressiveness of the external environment, etc.) | 0-5% |
| 6. Uncertainty in the process of mastering the applied equipment or technology. The possibility for participants to ensure compliance with technological discipline | 0-4% |
Methodology for calculating the discount rate by Ya. Khonko for various classes of investments
The scientist Ya. Honko presented a methodology for calculating risk premiums for various classes of investments/investment projects. These risk premiums are presented in aggregate form, and the investor needs to choose the investment objective and, in accordance with it, the risk adjustment. Below are the aggregate risk adjustments depending on the purpose of the investment. As you can see, with an increase in the size of the risk, the ability of the enterprise / company to enter new markets, expand production and increase competitiveness also increases.
Summary
In this article, we looked at 10 methods for estimating the discount rate that use different approaches and assumptions in the calculation. The discount rate is one of the central concepts in investment analysis, it is used to calculate indicators such as: NPV, DPP, DPI, EVA, MVA, etc. It is used in estimating the value of investment objects, shares, investment projects, and management decisions. When choosing an assessment method, it is necessary to take into account for what purposes the assessment is made and what initial conditions. This will allow for the most accurate assessment. Thank you for your attention, Ivan Zhdanov was with you.